Four Unshakeable Lessons from a Year of Whiplash
Congratulations everybody, we made it through an unforgettable year. Here’s an incomplete list of some of the craziest things that happened in the financial markets over the past year:
- Oil prices went (briefly) negative.
- Small-cap stocks (as measured by the Russell 2000) fell 42%, then rallied 99%.
- An electric car company that has never sold a single car was valued higher than Ford.
- Pfizer, who shattered records by developing a life-saving vaccine in nine months, saw its stock barely eke out a positive return on the year.
- Bitcoin tripled to reach all-time highs.
- Mortgage rates dropped to all-time lows.
- Global stocks (as measured by Vanguard Total World Stock ETF) had their 2nd, 3rd, and 5th worst single-day losses of all time. They also had their 2nd and 3rd best daily gains of all time. This all happened in just 12 trading days.
- Gold finally surpassed its previous high from 2011.
- Richard Lustig gave the worst financial advice I’ve ever seen.
We may never see another year like 2020, but that doesn’t mean that we can’t learn from it. Here are the four timeless lessons from an unprecedented year.
1. The stock market can be crazy, but that doesn’t mean it’s inefficient.
The wild swings of the market this year can only be described as “bonkers.” From February 19th to March 23rd, global stocks (as measured by the Vanguard Total World Stock ETF) fell 34%. During those 23 days where the stock market was open, investors had assessed the coronavirus situation and determined that the world’s businesses were worth just two-thirds of their pre-coronavirus value. With the global economic shutdown underway, a Great Depression scenario seemed imminent. A full recovery, if even imaginable, felt years away. It was difficult to find any market commentary with a hint of optimism (we had you covered though 😉).
Just about nine months later, the stock market has surged 73%! Unbelievably, the world’s businesses are now valued 17% higher than they were at the beginning of the year!
That is crazy. With hindsight, it seems obvious that March’s lows were too low. It seems possible that the current highs are too high. In fact, it seems like the market has been wrong all year. Believe it or not, that is the key to the market’s efficiency, not a refutation of it. Burton Malkiel, legendary economist and a leading proponent of the efficiency of markets, explains why:
“What the efficient market hypothesis does not mean is that markets are always correct. In fact, I would say the price is always wrong. It’s just that we don’t know for sure whether it’s too high or too low. Nobody can consistently beat the market. Over time the market is the only one that gets it right.”
The stock market’s next move will probably surprise most people, because, in the near-term, the stock market is full of surprises. Over the long-term, however, the trend is obvious. Next time the market is going haywire, avoid the urge to predict its next move and recognize that bouts of craziness are a regular occurrence on the path to long-term wealth accumulation.
2. Generational buying opportunities are impossible to appreciate when it feels like the sky is falling.
As someone who’s studied market history, I’ve longed for a “generational buying opportunity.” I didn’t have any money back in 2009. Or a brokerage account. Or really any awareness of what was happening in the stock market. But in the years since, I’ve learned how even a small investment at a generational bottom could quickly compound into a nice sum. Coming into this year, S&P 500 had only experienced nine intra-year declines of at least 30%, and five of those occurred during the Great Depression. I promised myself that if I were lucky enough to see the proverbial “fat pitch,” I’d be sure to swing for the fences.
There were two problems with my plan, both of which now seem obvious. I had no way of knowing when the market would finally bottom, and I had no idea how I’d feel when it finally did.
I’ve been very transparent about my personal investments and even posted an article on March 5th detailing how I was positioning my portfolio amid the Coronavirus chaos. At that point, global stocks had fallen about 10%, and I thought it might be a good time to buy. A few weeks later when the market finally bottomed, global stocks had fallen another 27%. Ouch. Even at that point, nobody knew that we had hit a bottom, with a loud chorus predicting Great Depression-like losses for the stock market. I had invested too early, but it was equally bad for those who were too late. In the next month, stocks rallied 22%. Swinging at the fat pitch seems so easy with hindsight, but this pitch whizzed by like an Aroldis Chapman fastball in the dark. We didn’t even realize it was coming until after it thudded into the catcher’s mitt and the game had ended. Buying the dip worked out okay, but nailing a generational bottom is impossible without luck on your side.
The other problem with my plan was that I completely overlooked the kind of crises that accompany huge market crashes. If the first 10% drop looked like a buying opportunity, and the next 10% looked even more attractive, the third was simply demoralizing. By that point, the real-world effects of the virus were crushing. The virus itself was hitting closer to home, friends were getting laid off, and work was more stressful than ever. Having experienced a generational bottom firsthand, I’d never wish for another, because in the moment it felt like there was no end in sight. Which brings us to our next lesson…
3. The market is definitively NOT a representation of the economy.
In the graph below, red marks the market bottom on March 23rd, when unemployment was 4.4%. From there, markets took off like a rocket, but the economic data wasn’t getting any better. In fact, it was getting worse — the unemployment rate topped out at 14.7% in April (blue). But the rally between those two dots was +31%.

This is no coincidence. The same thing happened during the last recession. The unemployment rate increased by 15% between March and October, and yet the market rose 53%.

It’s not just unemployment, either. Almost every major economic indicator was getting worse while the market recovery took hold. The reason for this is very simple, yet often overlooked: All economic data has one thing in common — it is backward-looking. In direct contrast, the market always has its eyes set on the future.
There are countless ways to measure what has already happened with the economy, but the market is continuously calculating the odds of what will happen next.
Next time things look bleak (and there’s always a next time), remember the market will probably turn around long before we see any promising economic data. Things don’t get better when you can see the light at the end of the tunnel. Things get better when it’s pitch black and you’re terrified of an oncoming train.
4. The federal government can stop a recession in its tracks.
In 1996, then-Chairman of the Federal Reserve Alan Greenspan quipped, “If I’ve made myself too clear, you must have misunderstood me.” The M.O. of the Fed was vagueness bordering on secrecy. There was even a “briefcase indicator” that theorized if Greenspan’s briefcase appeared thicker than normal, he must be carrying extra documentation to support an interest rate adjustment.
Things have changed.
Earlier this year, Current Fed Chairman Jerome Powell plainly stated, “We’re not even thinking about raising rates. We are strongly committed to using our tools to do whatever we can for as long as it takes. ” Long gone are the days of scrutinizing briefcases.
Before 2020, we had an idea of the tools available to the Federal Reserve and Treasury Department to stimulate the economy. Now we know how expansive and effective those tools can be, and exactly how willing policymakers are to use them. This stimulus dwarfed the response to the Global Financial Crisis:
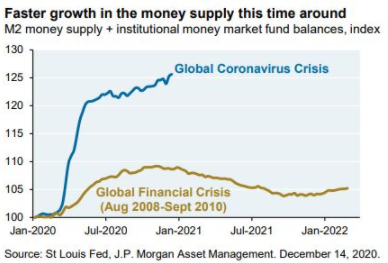
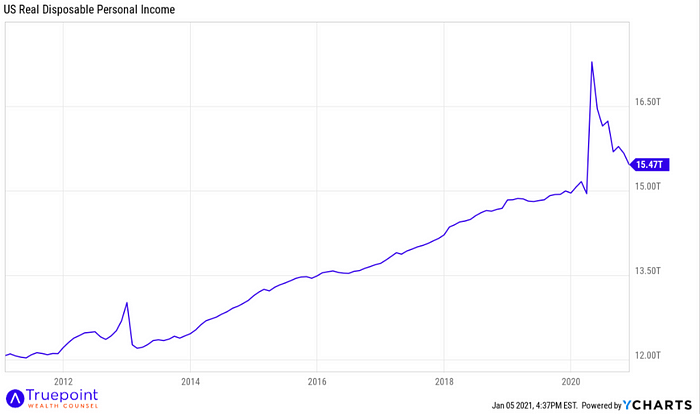
Here are a few charts you wouldn’t expect to see during a year that experienced a once-in-a-century pandemic, the worst quarterly GDP contraction ever, and record unemployment claims:
Average weekly earnings and disposable income grew to record levels.

The percentage of overdue credit card payments and the total level of credit card debt fell.

A historic spike in unemployment was followed by a historic drop. (Another victory lap — we predicted this one in our April commentary.)

Millions of people out of work could have led to a 2007-style housing bust. It didn’t.

On March 22nd, St. Louis Fed President James Bullard predicted the unemployment rate could hit 30% and GDP could experience a 50% drop. I t was not an outlandish prediction at the time. With the economy in a medically induced coma, massive monetary and fiscal stimulus was needed to stave off another Great Depression. It’s impossible to know exactly how badly things may have gotten, but one thing is clear — the coronavirus gashed the economy, and the federal government’s response helped stop the bleeding.
But the damage control measures aren’t without a cost.
Federal debt as a percentage of GDP has gone vertical.

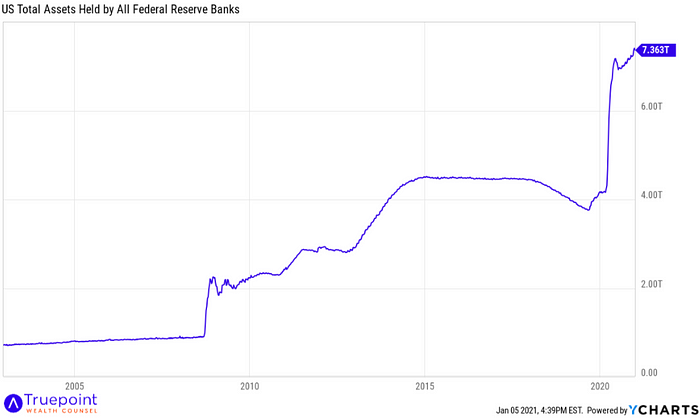
And the Federal Reserve’s balance sheet has ballooned to new heights.
In sum, the stimulus temporarily boosted individuals’ balance sheets (higher incomes, more savings, less debt) while weakening the federal government’s. Fortunately, unlike individuals, the government will never need to fully “pay off” its debt and has multiple ways to manage it. (For more information on how the government will handle the rising debt, check out this webinar.) With a proven track record of stopping a recession in its tracks and a few options for managing the associated debt, I think it’s reasonable to assume that similar stimulative measures will be used in the future.
Oftentimes, periods of struggle plant the seeds for growth. You survived the struggle of 2020, might as well use the valuable lessons to help you be a better investor.
Commas, through our parent Truepoint, Inc. is a fee-only Registered Investment Adviser (RIA). Registration as an adviser does not connote a specific level of skill or training. More detail, including forms ADV Part 2A & Form CRS filed with the SEC, can be found at usecommas.com. Neither the information nor any opinion expressed, is to be construed as personalized investment, tax, or legal advice. The accuracy and completeness of information presented from third-party sources cannot be guaranteed. Commas is a wholly-owned subsidiary of Truepoint Inc.